Campaign reports
Tapstream campaigns collect and display aggregate performance data in real time. Campaigns are automatically organized into labels by campaign type (for specific ad networks, or custom, cross-promotion, or App Invite campaigns).
Campaigns overview
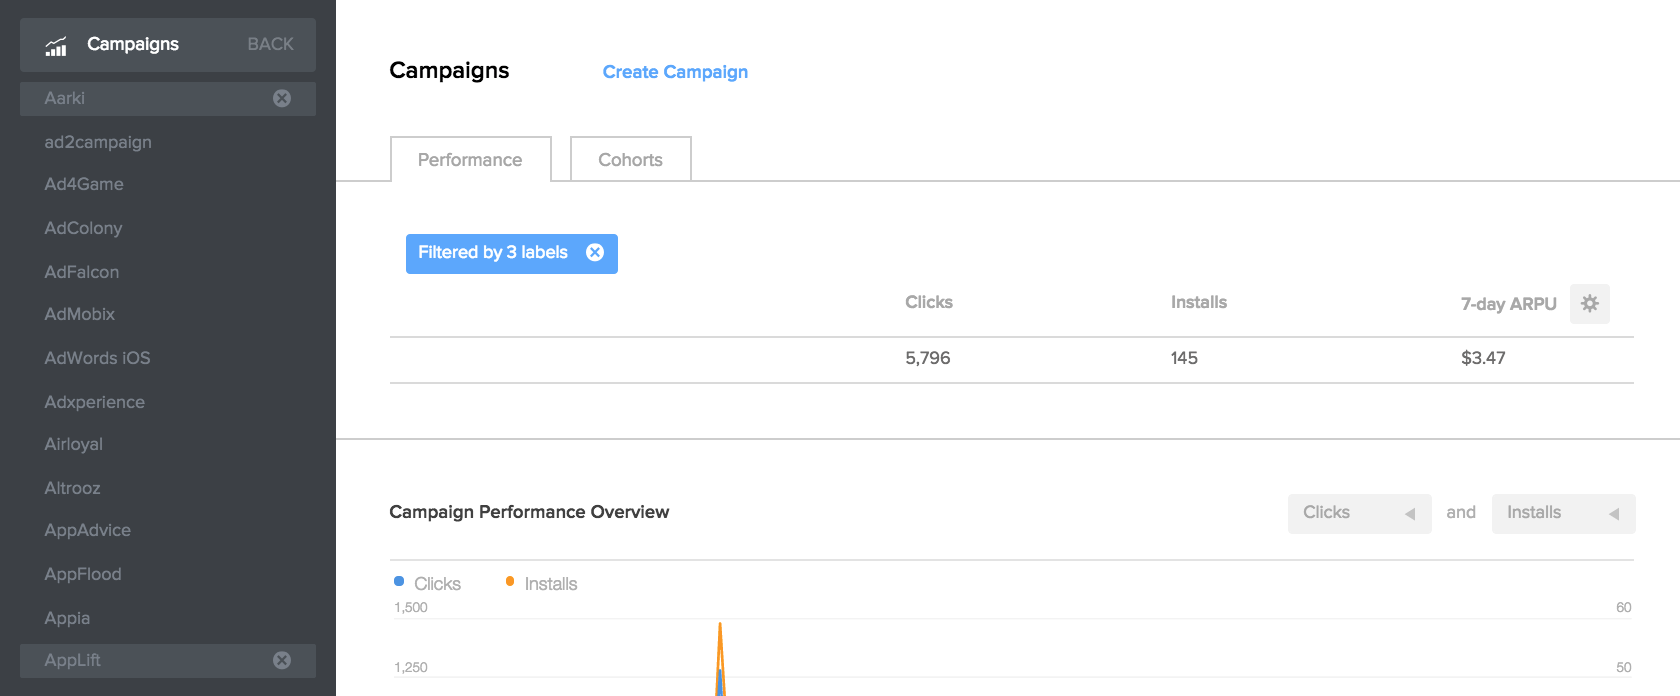
The Campaigns overview screen is accessible directly from Tapstream's main navigation. It offers two views: Performance, which shows you clicks, installs, and ARPU for your campaigns, and Cohorts, which shows you ARPU and retention for your campaigns.
Selecting campaign types from the leftmost pane will filter all data on this screen, in both tabs.
Campaigns overview, Performance
The Performance tab of the Campaigns screen offers three representations of your campaign data. All three representations respect the date range and any filters you've set.
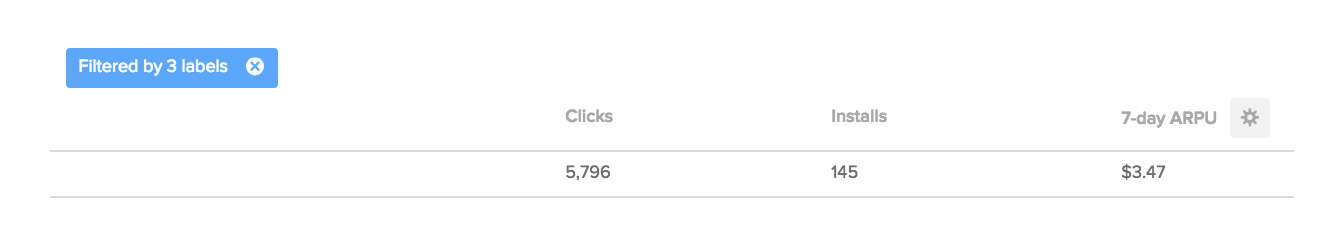
The totals bar, at the top of the screen, shows clicks, installs, and your "money number". Your "money number" can be configured to be your campaigns' 1-, 3-, 7-, or 30-day ARPU, or your campaigns' total earnings.
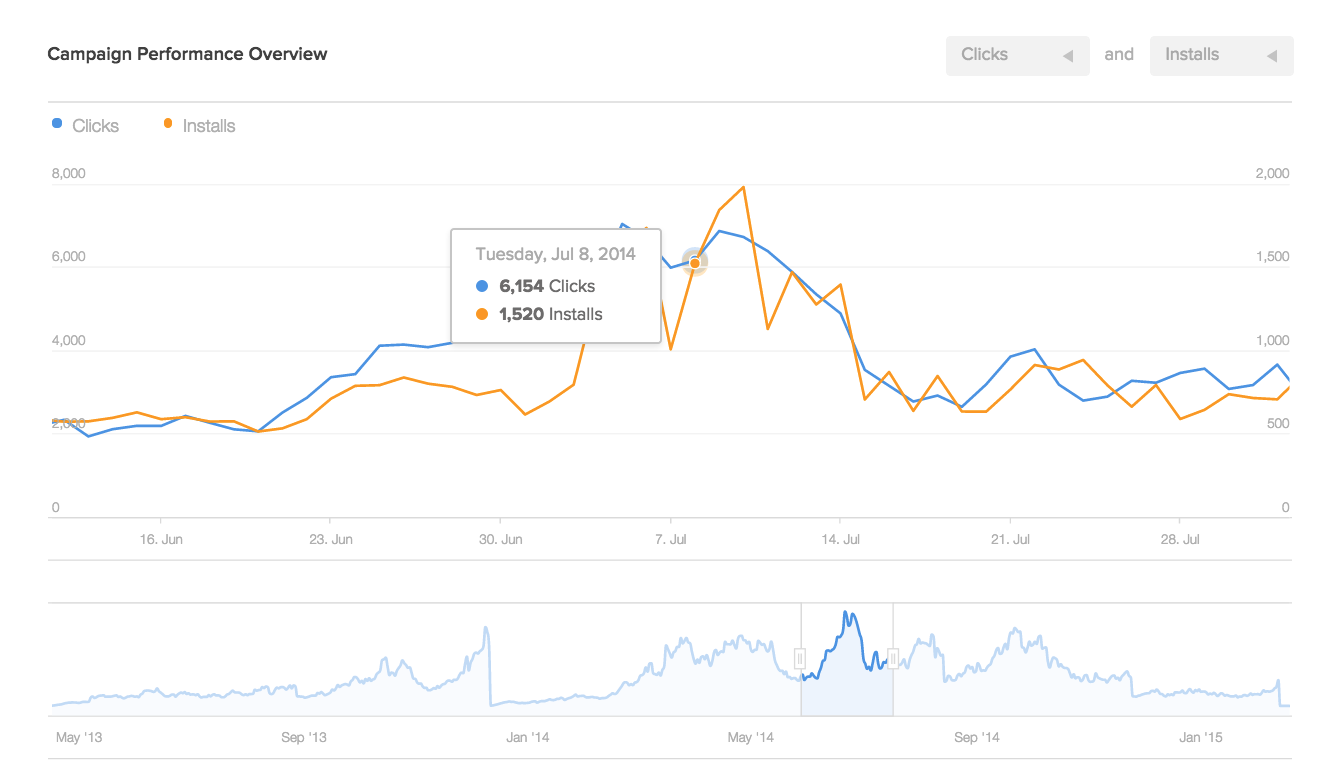
The campaign performance overview, in the middle of the screen, is a chart that shows two configurable series over the date range you select. Available series are:
- Clicks: The number of entry points into this campaign
- Installs: The size of the campaign's app cohort
- n-day ARPU: The Average Revenue per User n days after the app cohort began
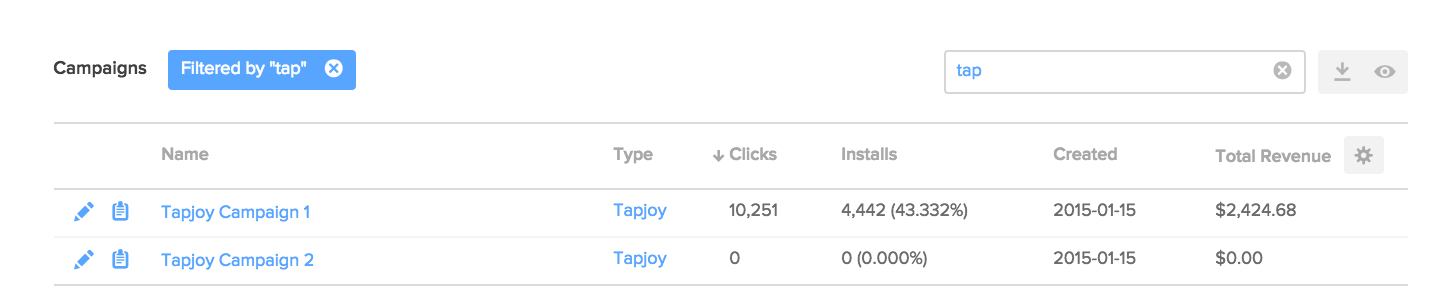
The campaigns table, at the bottom of the screen, is a table that shows a list of all of your campaigns.
All data on this screen can be filtered by the text input box above this table. Next to the filter input box are controls for downloading a CSV of this table, and hiding campaigns that don't have data from the table.
Each row in the table itself has the following columns:
- Edit: Takes you to a screen where you can edit the behavior and details of the campaign
- Copy link: Copies the campaign's URL, like
http://taps.io/my-campaign/, to your clipboard - Campaign name: Takes you to a detailed report on this campaign's performance
- Type: The campaign's category
- Clicks: The number of entry points into this campaign
- Installs: The size of the campaign's app cohort
- Created: The date on which this campaign was created by you
- Money number: As above, either this campaign's n-day ARPU, or the total revenue generated by the campaign so far
Campaigns overview, Cohorts
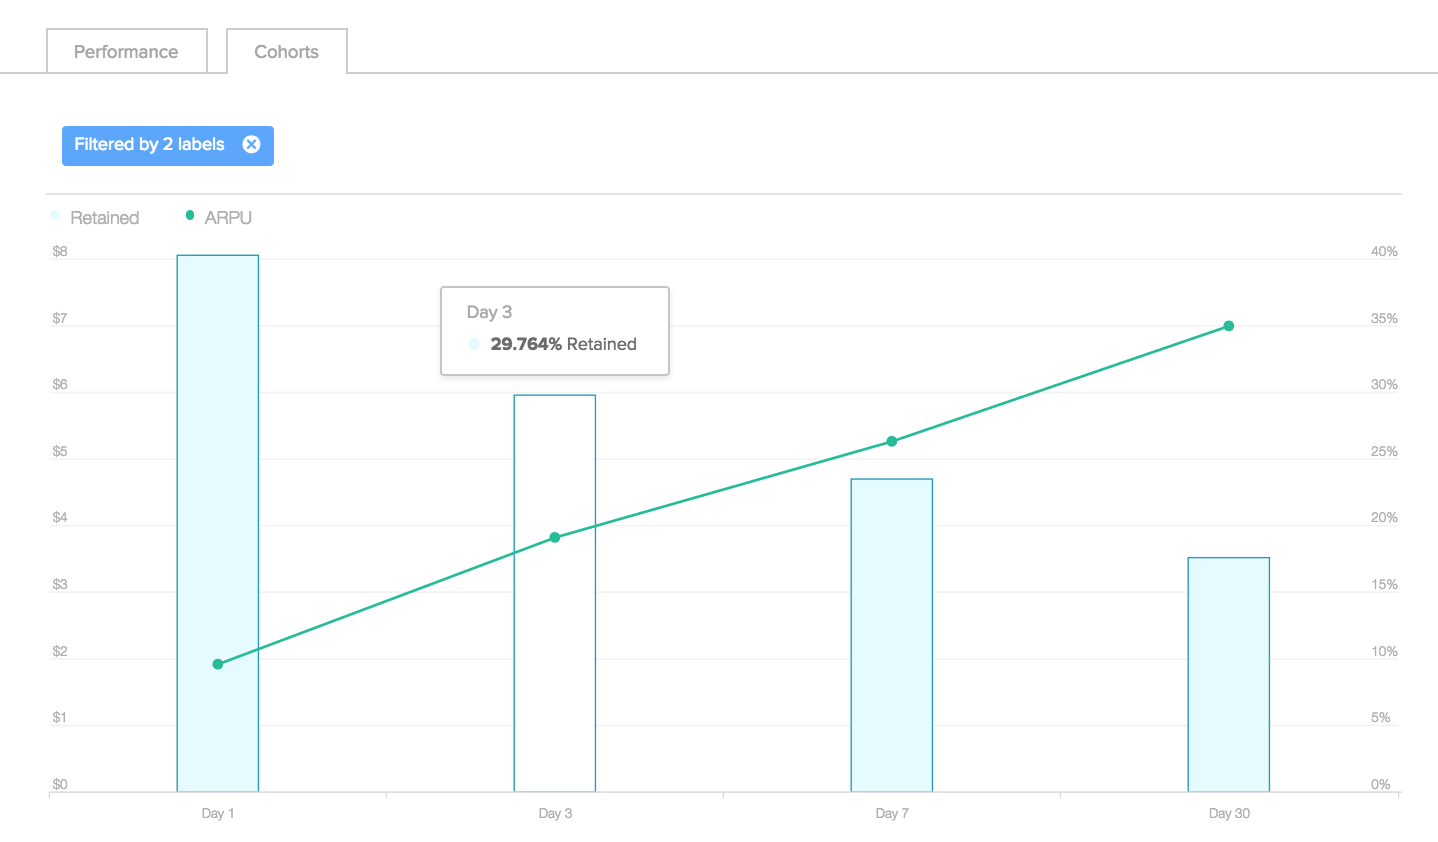
The Cohorts tab of the Campaigns screen shows two views of the aggregated behavior of the campaign's cohort.
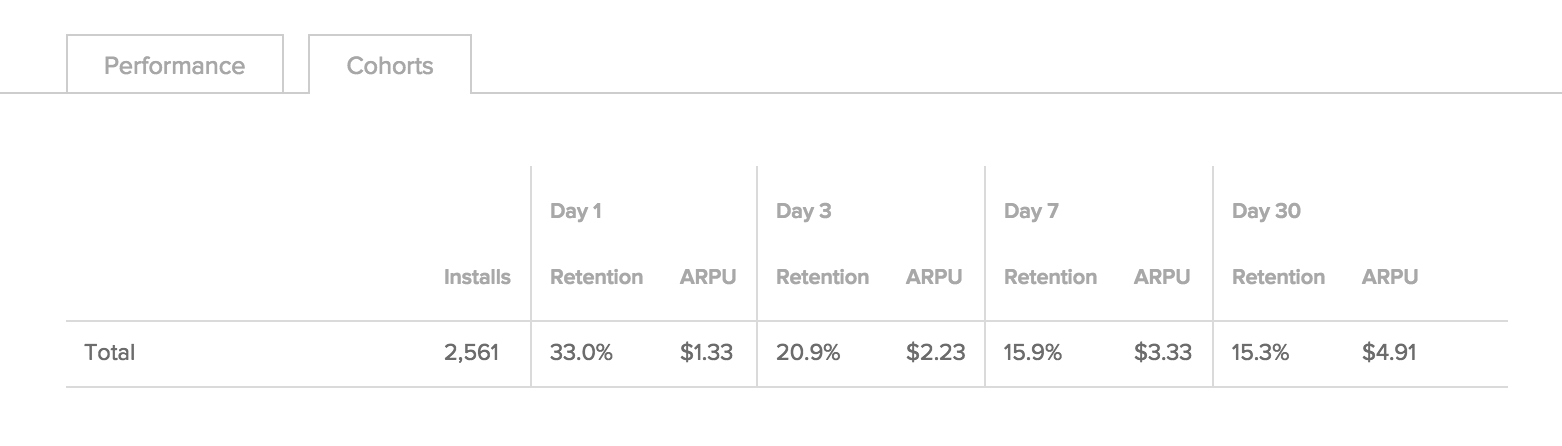
The campaigns cohorts overview shows the retention and average revenue per user for four date buckets (1, 3, 7, and 30 days), scoped to the date range you configured and any filters you've applied.
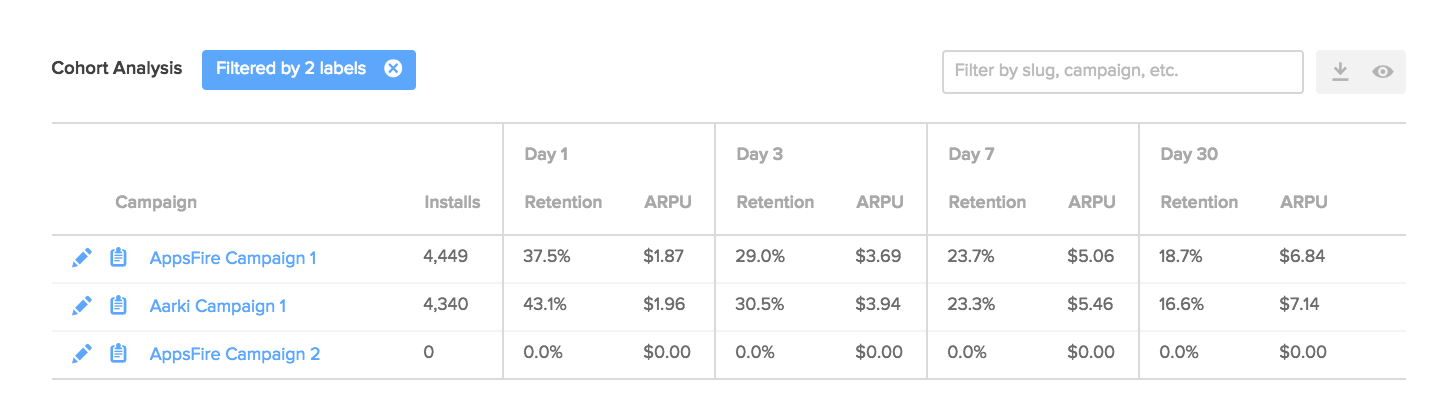
The cohort analysis table shows your retention and ARPU for each date bucket, as well as offering the same filter input, CSV download functionality, and "hide empty" functionality as the campaigns table on the Performance tab.
Campaign details
Each campaign has a Details page. This page shows detailed performance and cohort data scoped to the individual campaign. You can reach your campaigns' details pages by clicking on a campaign's name in either the campaigns table (on the Performance tab) or the cohort analysis table (on the Cohorts tab).
Campaign details, Performance
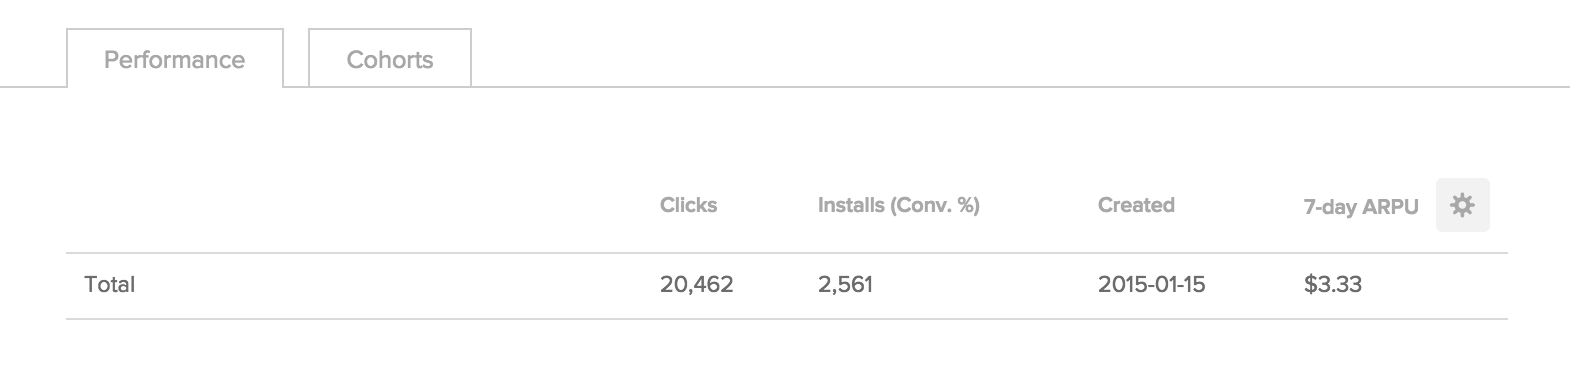
The Performance tab of the campaign details screen offers two aggregated representations of your campaign data.
The totals bar, at the top of the screen, shows campaign entries, the size of the app user cohort, and your "money number".
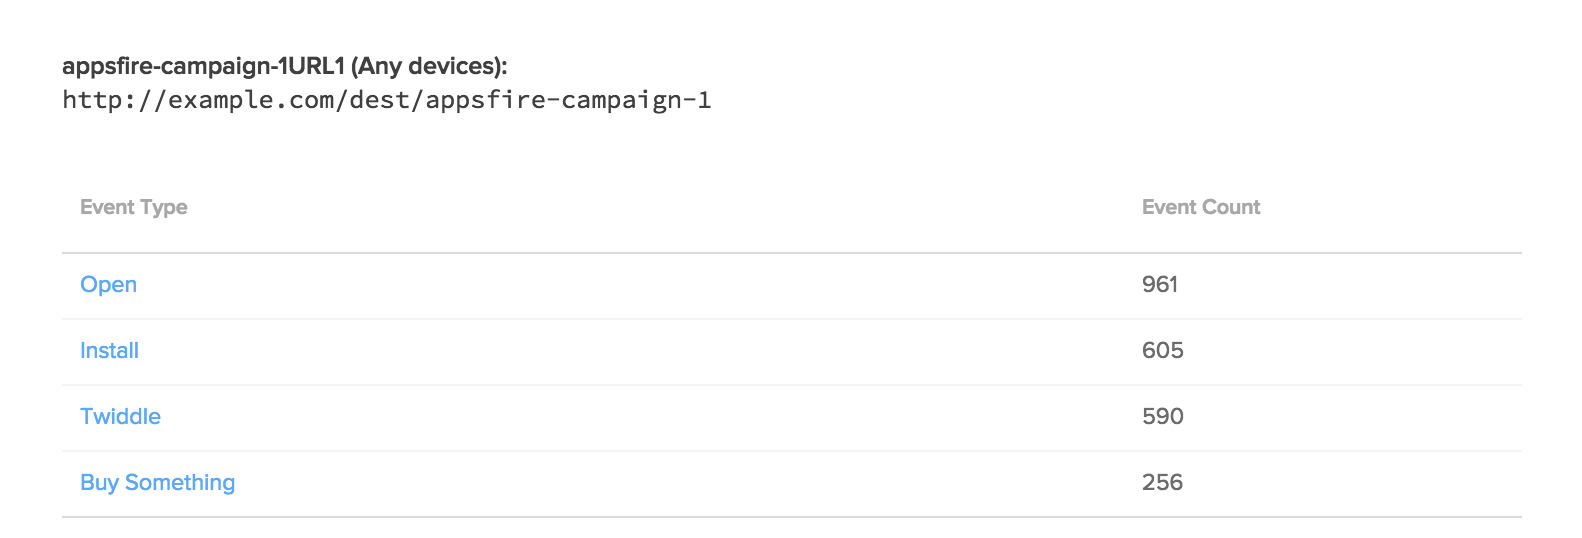
The destination breakdown table, at the bottom of the screen, breaks out each of your campaign's destination URLs. For each of your campaign's destination URLs, it shows the size of the cohort.
Campaign details, cohorts
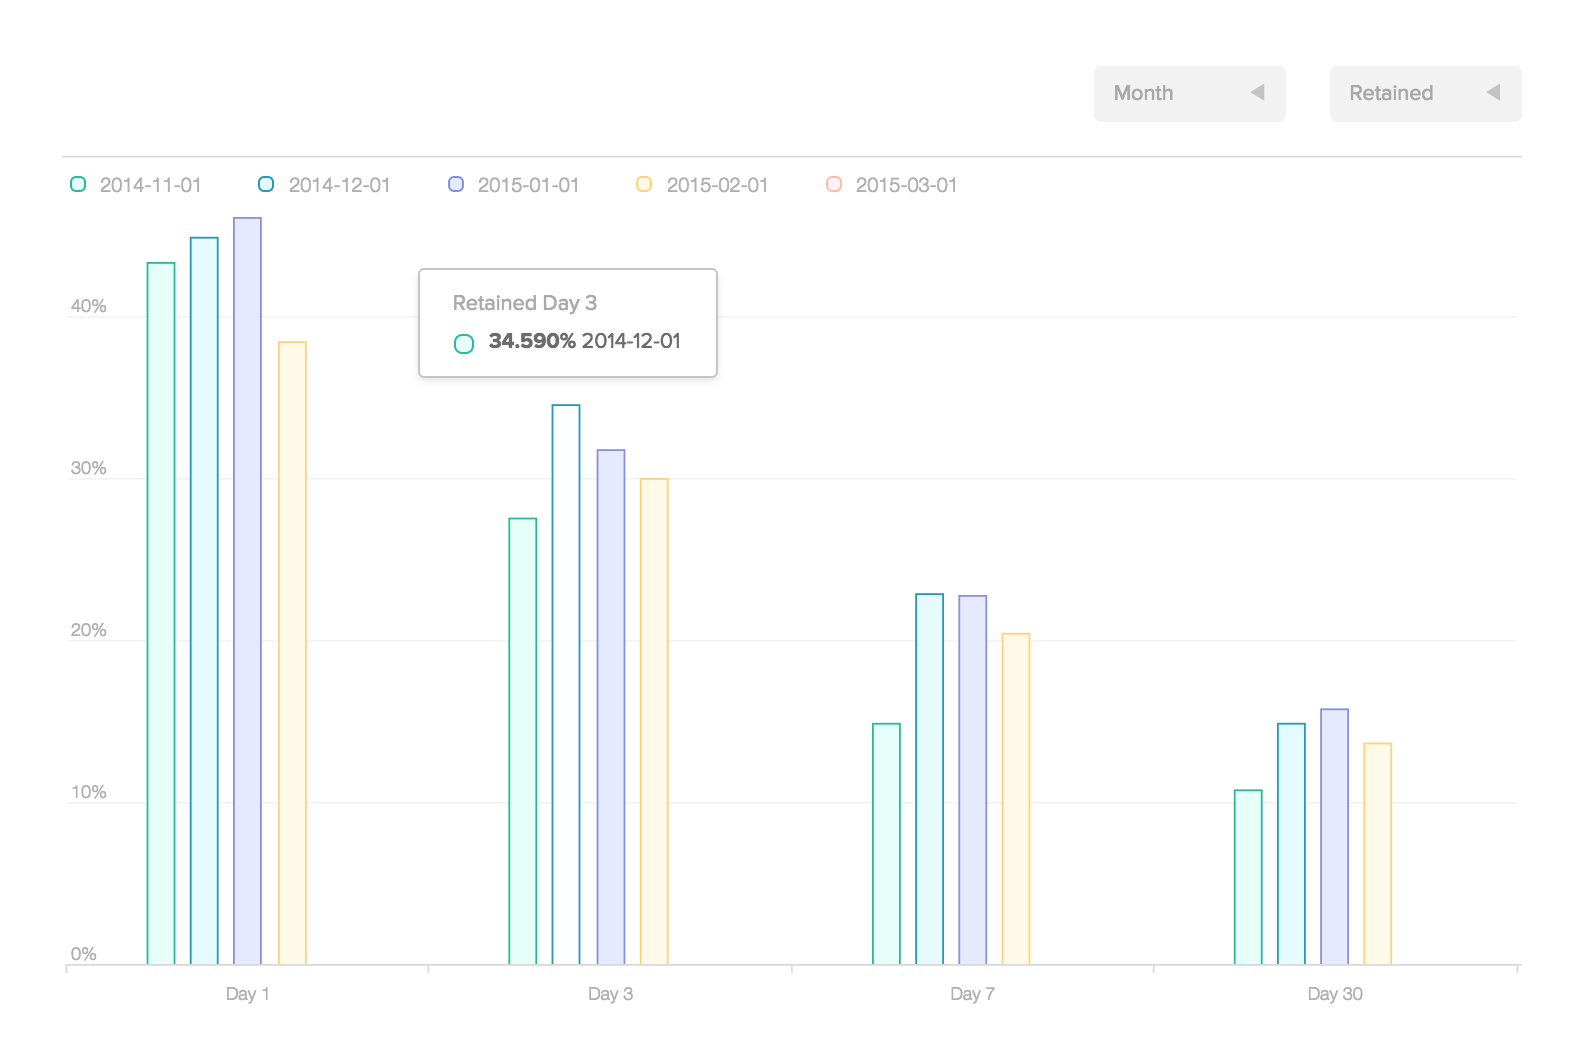
The Cohorts tab of the campaign details screen shows how the campaign's cohorts perform in aggregate, and week-by-week or month-by-month over time.
The totals bar, at the top of the screen, shows the size of the app user cohort from this campaign, and the cohort's aggregate 1-, 3-, 7-, and 30-day retention and ARPU.
The cohorts chart, at the bottom of the screen, shows how the retention or ARPU of the campaign's cohort changed over time. You can change whether the chart shows retention or ARPU, or columns for weeks or months, using the chart's series selectors.